Fig. 8
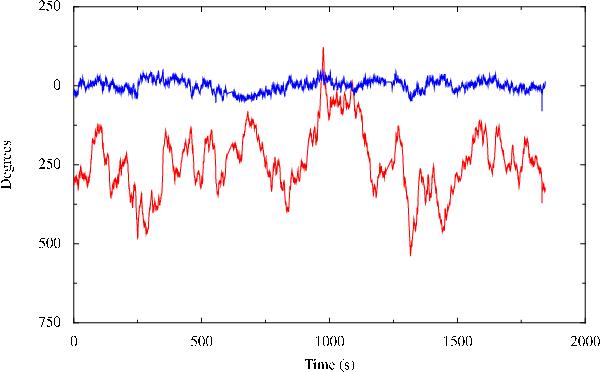
Test observation at 90 GHz of a strong quasar on a ~650 m baseline with ALMA. The red line is the phase of the observed (complex) visibility on this baseline – note that for a quasar (or other point-like) source at the tracking centre of the interferometer we expect a constant phase in time. The blue line is the visibility phase after correction of the data based on the WVR signals and using the wvrgcal program.
Current usage metrics show cumulative count of Article Views (full-text article views including HTML views, PDF and ePub downloads, according to the available data) and Abstracts Views on Vision4Press platform.
Data correspond to usage on the plateform after 2015. The current usage metrics is available 48-96 hours after online publication and is updated daily on week days.
Initial download of the metrics may take a while.